Parts list: projects

Eleven end-to-end projects: forecasting, machine learning, NLP, computer vision, LLM workflows, reinforcement learning, and BI. Every metric below is reproducible from the linked repositories; two projects run live.

Pos.DesignationKey metricStackStatus
01FreshMart Demand PlannerRMSE 138.0Python · MLflow · StreamlitLive
02Predictive Maintenance: Fleet Risk & CostPR-AUC 0.902XGBoost · SHAP · SQLGitHub
03NLP: Disaster Tweets Classificationaccuracy 0.819scikit-learn · DistilBERTGitHub
04CIFAR-10 Transfer Learning Studyaccuracy 82.7%TensorFlow · ResNet50GitHub
05TravelTide: Customer Segmentationusers 5,998SQL · DatabricksGitHub
06Retail KPI Dashboardmonths 48Tableau · LODLive
07IATF Quality Report Promptno invented figures 7/7Claude · Python stdlibGitHub
08Car Price Estimatormedian error 11.9%Python · XGBoostGitHub
09AI Order Triage Agentanswer key 30/30n8n · Gemini · AirtableGitHub
10FX Random Walk Benchmarkerror explained r = 0.97Python · statsmodels · XGBoostGitHub
11Neuron Platformer RLheld-out success 80%PyTorch · Stable-Baselines3GitHub
Pos. 01 · Apr–May 2026 Live

FreshMart Demand Planner

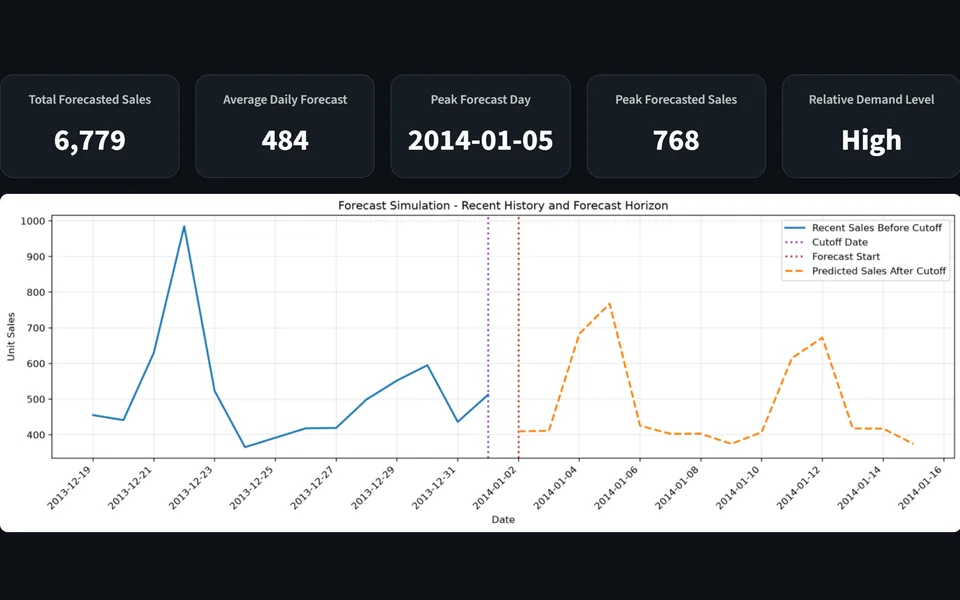
End-to-end retail demand forecasting: EDA, feature engineering, 10+ models compared (SARIMAX, Prophet, XGBoost, LSTM), HyperOpt tuning, and MLflow experiment tracking. Deployed as a Streamlit planning tool that speaks the language of store managers: total demand, peak day, average daily forecast.

champion RMSE 138.0 MAE 93.1 models 10+
PythonTimeSeriesXGBoostMLflowStreamlit
Pos. 02 · Apr–May 2026

Predictive Maintenance: Fleet Risk & Cost

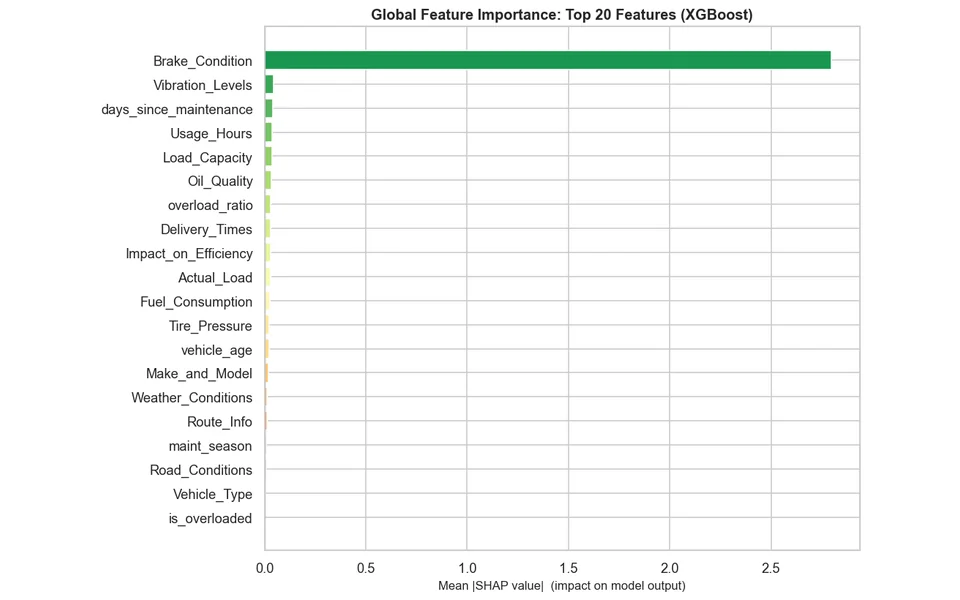
Three business questions answered on a 92,000-row logistics fleet dataset: which vehicles need maintenance (classification), what it will cost (regression), and how to segment the fleet by risk (clustering). SHAP analysis identified brake condition as the dominant failure predictor, exactly what 17 years in vehicle engineering would suggest.

PR-AUC 0.902 0.885 rows 92k
PythonXGBoostSHAPSQLClustering
Pos. 03 · Jun 2026

NLP: Disaster Tweets Classification

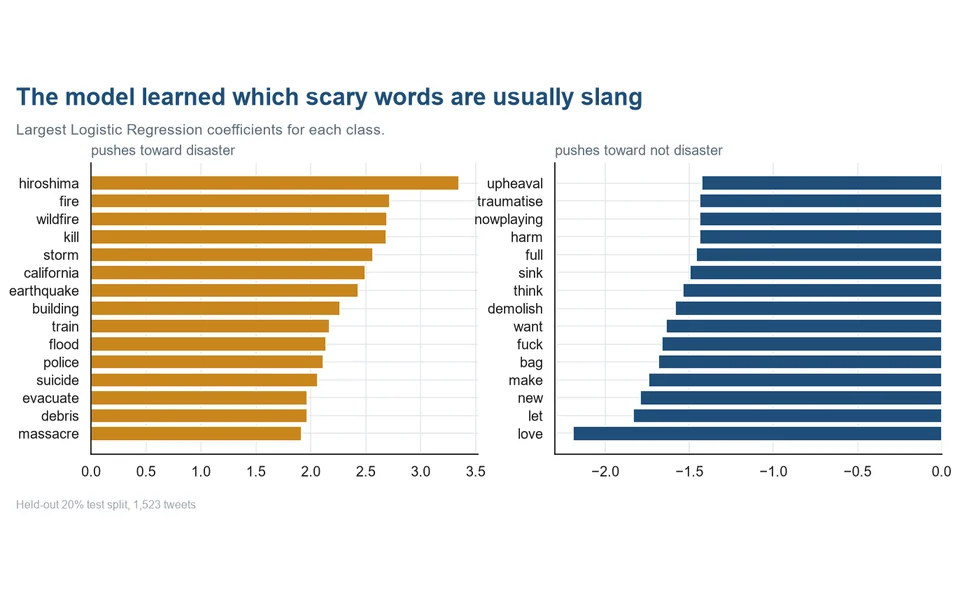
Does a tweet report a real disaster, or is "this album is fire" just slang? I shipped an interpretable TF-IDF + Logistic Regression classifier and stress-tested it against a from-scratch CNN and a fine-tuned DistilBERT. The explainable model won the trade-off: every flagged tweet can be defended word by word, which matters more than the last two points of accuracy.

accuracy 0.819 Kaggle public 0.791 DistilBERT bench 0.839
Pythonscikit-learnNLTKPyTorchDistilBERT
Pos. 04 · May 2026

CIFAR-10 Transfer Learning Study

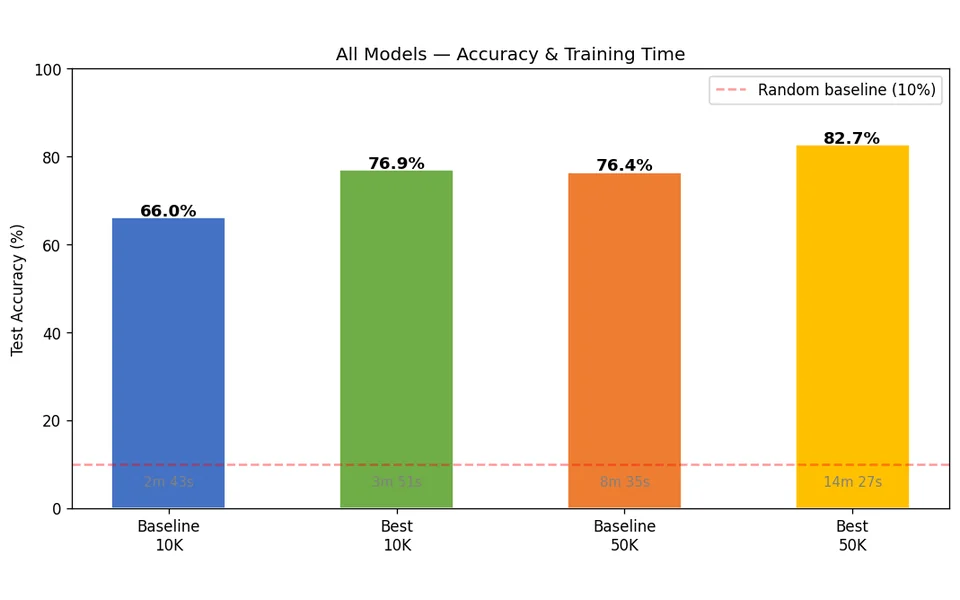
A controlled ablation study with ResNet50: isolating the impact of dataset size, augmentation, learning-rate scheduling, and partial unfreezing, tested individually and combined. Grad-CAM visualizations show what the model actually attends to. The same mechanism drives automated visual inspection in manufacturing.

accuracy 66% → 82.7% images 60k
TensorFlowKerasResNet50GradCAM
Pos. 05 · Mar–Apr 2026

TravelTide: Customer Segmentation

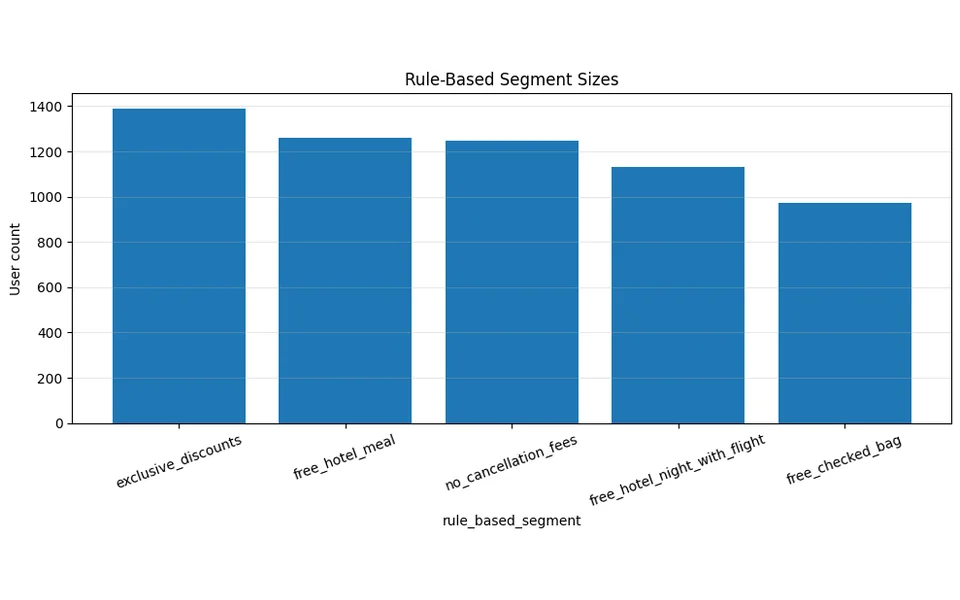
Retention targeting for a travel platform: a SQL pipeline in Databricks aggregated 49,211 sessions into 30+ behavioral features for 5,998 users, then a rule-based perk-fit score assigned each user the most relevant reward. K-Means and DBSCAN served as benchmarks; the interpretable approach won on stability and deployment readiness.

users 5,998 segments 5 balanced features 30+
SQLSparkSQLDatabricksPython
Pos. 06 · Feb 2026 Live

Retail KPI Dashboard

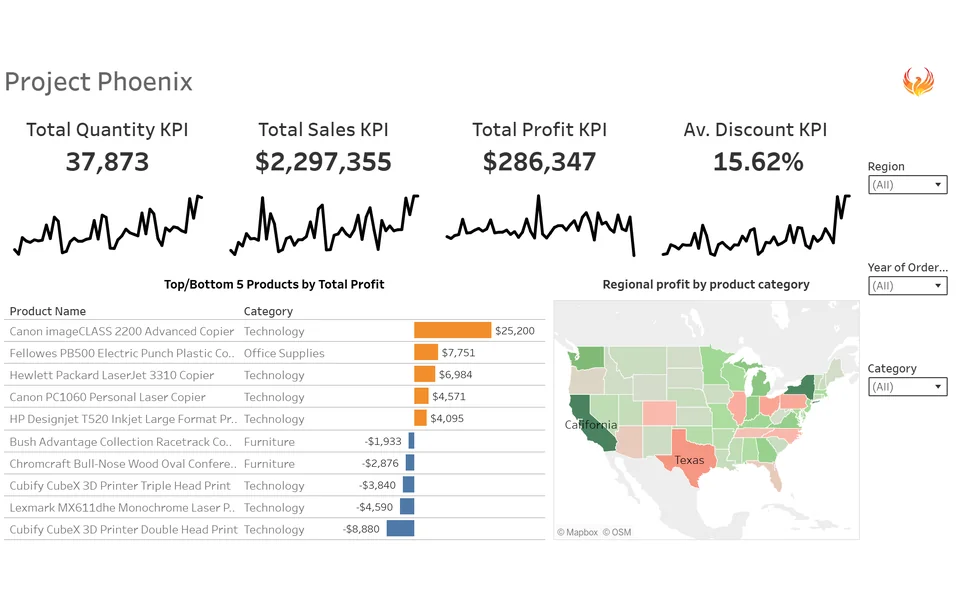
Interactive Tableau dashboard tracking sales, profit, discount, and orders with drill-downs by region, product category, and time. LOD expressions and dashboard actions give non-technical users self-service analysis, the same logic as a quality trend board in a plant.

rows ~10k months 48 states 49
TableauLODDashboardActions
Pos. 07 · Jul 2026

IATF Quality Report Prompt

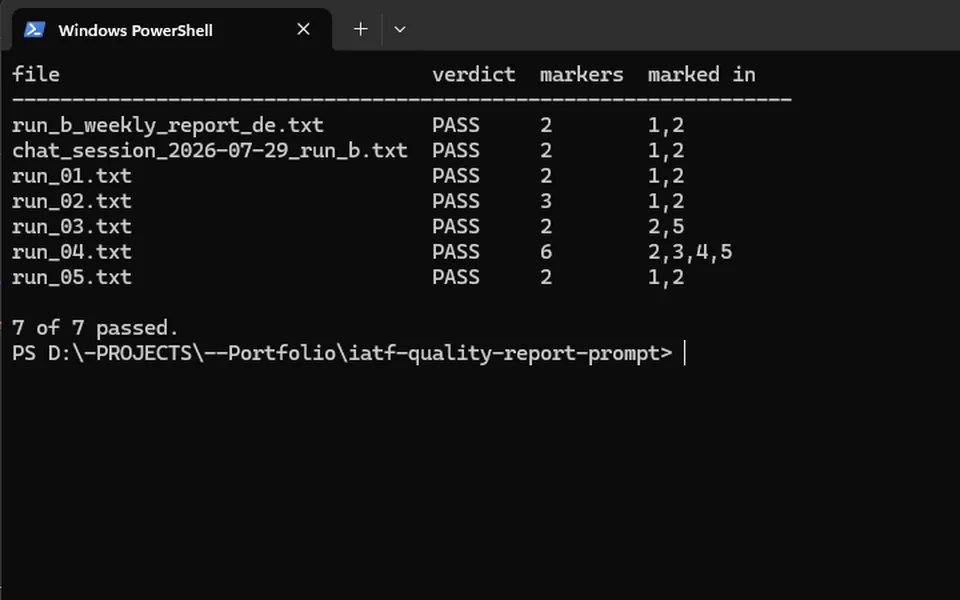
Can a language model be stopped from filling a gap in a controlled record? A three-zone prompt drafts German ISO 9001 / IATF 16949 quality reports and is forbidden to derive any figure it was not given: in a QMS record a derived figure is an audit finding even when the arithmetic is right. A negative-control test withheld one figure and left both operands in as bait. No run computed it; the gap marker appeared in both required places in only 5 of 7 runs, and that weaker number is published as found, prompt deliberately unfixed.

no invented figures 7 of 7 runs gap marked twice 5 of 7 own defects published 3
Claude Opus 5Prompt engineeringTest designPython
Pos. 08 · Jul 2026

Car Price Estimator

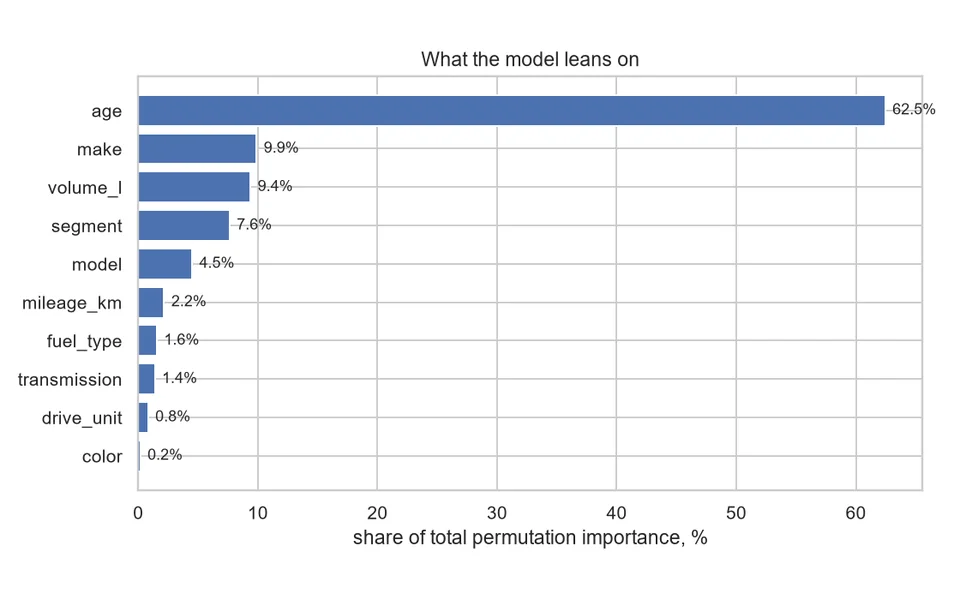
A pricing tool that returns a calibrated price range instead of a single number, built on 56,244 used-car listings. Two of the three required model families lost to a dealer-style lookup table; XGBoost won, and its real gain sits on cars the lookup has never seen: 46% better. The finding worth arguing about after 17 years in automotive: mileage barely predicts price once age is known, at 2.2% of permutation importance against 62.5% for age.

median error 11.9% lookup baseline 13.3% MAE $1,016
PythonpandasXGBoostConformal prediction
Pos. 09 · Jul 2026

AI Order Triage Agent

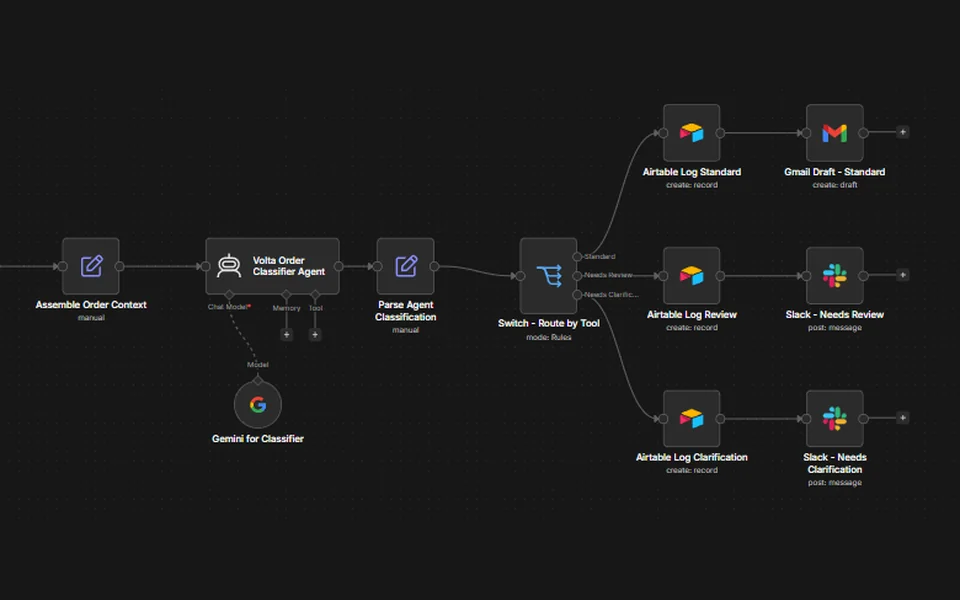
A 26-node n8n workflow that triages free-text wholesale orders in English and Portuguese. Deterministic Airtable lookups gather every fact first; one bounded LLM agent makes the single call a rule cannot express; logic routes and logs every order, and a human stays the sender: the workflow never contacts a customer. Across three runs of each of the ten sample orders, all 30 recorded classifications matched the course answer key, and no input ever produced two different classifications. Built on a fictional wholesale case, Volta Coffee Roasters in Porto.

answer-key match 30 / 30 AI steps 2 of 8 nodes 26
n8nGeminiAirtableSlackGmail API
Pos. 10 · Jul 2026

FX Random Walk Benchmark

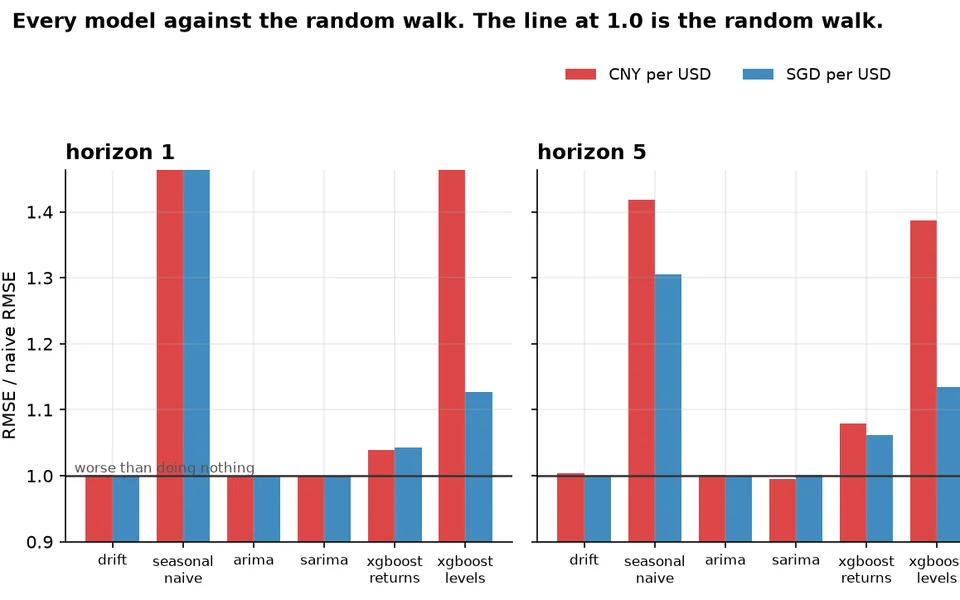
A banking brief asked for an exchange-rate forecaster. The project asked the question the brief did not: compared to what? Twenty years of daily SGD/USD and CNY/USD, the naive "tomorrow equals today" baseline built first, then ARIMA, SARIMA and gradient boosting scored against it across 42,924 walk-forward forecasts. Not one beat the baseline at any significance level, AIC selected ARIMA(0,1,0), which is the random walk itself, and a purpose-built move_ratio measure explains every model's error at r = 0.97. The no-leakage claim is not an assurance but a mechanical proof: rewrite every observation after the cut date and the earlier features must come back byte-identical.

walk-forward forecasts 42,924 models beating naive 0 error explained r = 0.97
PythonstatsmodelsXGBoostDiebold-MarianoBacktesting
Pos. 11 · Jul–Aug 2026

Neuron Platformer RL

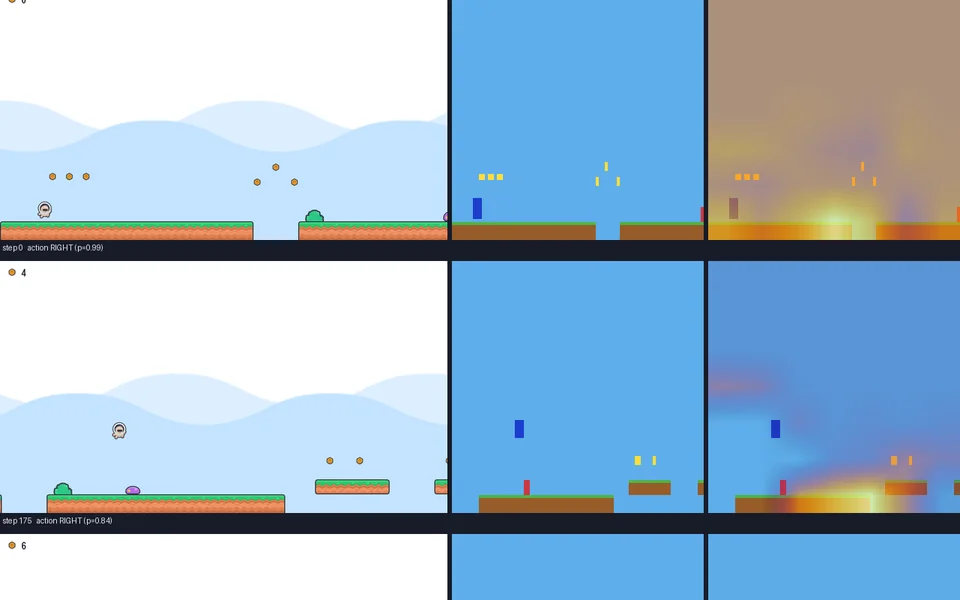
Reinforcement learning demos usually run inside somebody else's environment, which hides the hard parts: reward design, observation design, and whether the task is solvable at all. Here the whole stack is built, including a level generator whose every gap is capped by the exact jump physics and an audit that re-proves solvability across 1,200 seeds. Then the real question: an agent reading raw 84x84 pixels, with no coordinates, velocities or object lists, beats the hand-crafted state-vector baseline 80% to 27% on 200 held-out levels, and a difficulty curriculum carries it to 52% medium and 55% hard. Grad-CAM shows where it looks: platform edges before a jump, the gap, the enemy. A fourth phase replaces the frame stack with an LSTM reading one frame at a time: recurrence does learn the game, but lands behind the frame stack on every tier - 29.5% medium against the curriculum's 52%. Getting these numbers honest took three extra experiments: doubling the LSTM's budget refuted the write-up's own excuse (typical performance rose, the peak did not), a noise analysis showed a 30-episode evaluation is worth about plus or minus 14 points, and a 200-seed re-measurement of all four models replaced every headline figure - the state baseline's published 50% was really 27%. The write-up was rewritten rather than left flattering.

pixel agent 80% state baseline 27% impossible transitions 0 of 11,619
PythonPyTorchStable-Baselines3GymnasiumGrad-CAM

More projects and work in progress on GitHub and Tableau Public.

Want the story behind these projects?

17 years of automotive engineering shaped how I approach every dataset: root cause first, business impact second, tooling third.

Metrics reproduciblefrom linked repositories