02 Projects / Process sheet PS-01
FreshMart Demand Planner
End-to-end sales forecasting: EDA, feature engineering, model comparison across statistical, ML, and deep-learning families, HyperOpt tuning, and a deployed Streamlit tool for store managers.
Purpose & scope
Replace manual planning with a forecast
A grocery store manager needs to plan inventory and staffing for the next period. The dataset: daily unit sales derived from Corporación Favorita competition data, enriched with oil prices and holiday features. The task: turn manual planning into a systematic, ML-based demand forecast.
Operation sequence · Routing
Five operations, one pipeline
Like a manufacturing routing sheet: numbered operations, each with a defined scope. One notebook per operation.
| Op. | Operation | Scope |
|---|---|---|
| 10 | EDA & cleaning | decomposition, stationarity checks, outlier review |
| 20 | Feature engineering | calendar, lag, rolling, oil price, holiday features |
| 30 | Statistical models | SARIMAX, Holt-Winters, Prophet |
| 40 | ML training & tuning | Linear / Ridge / RF / GBM / XGBoost + LSTM · HyperOpt search · MLflow tracking |
| 50 | Deployment | Streamlit planning app: cutoff date, horizon, KPI summary, CSV export |
Measured values · Test period Jan–Mar 2014
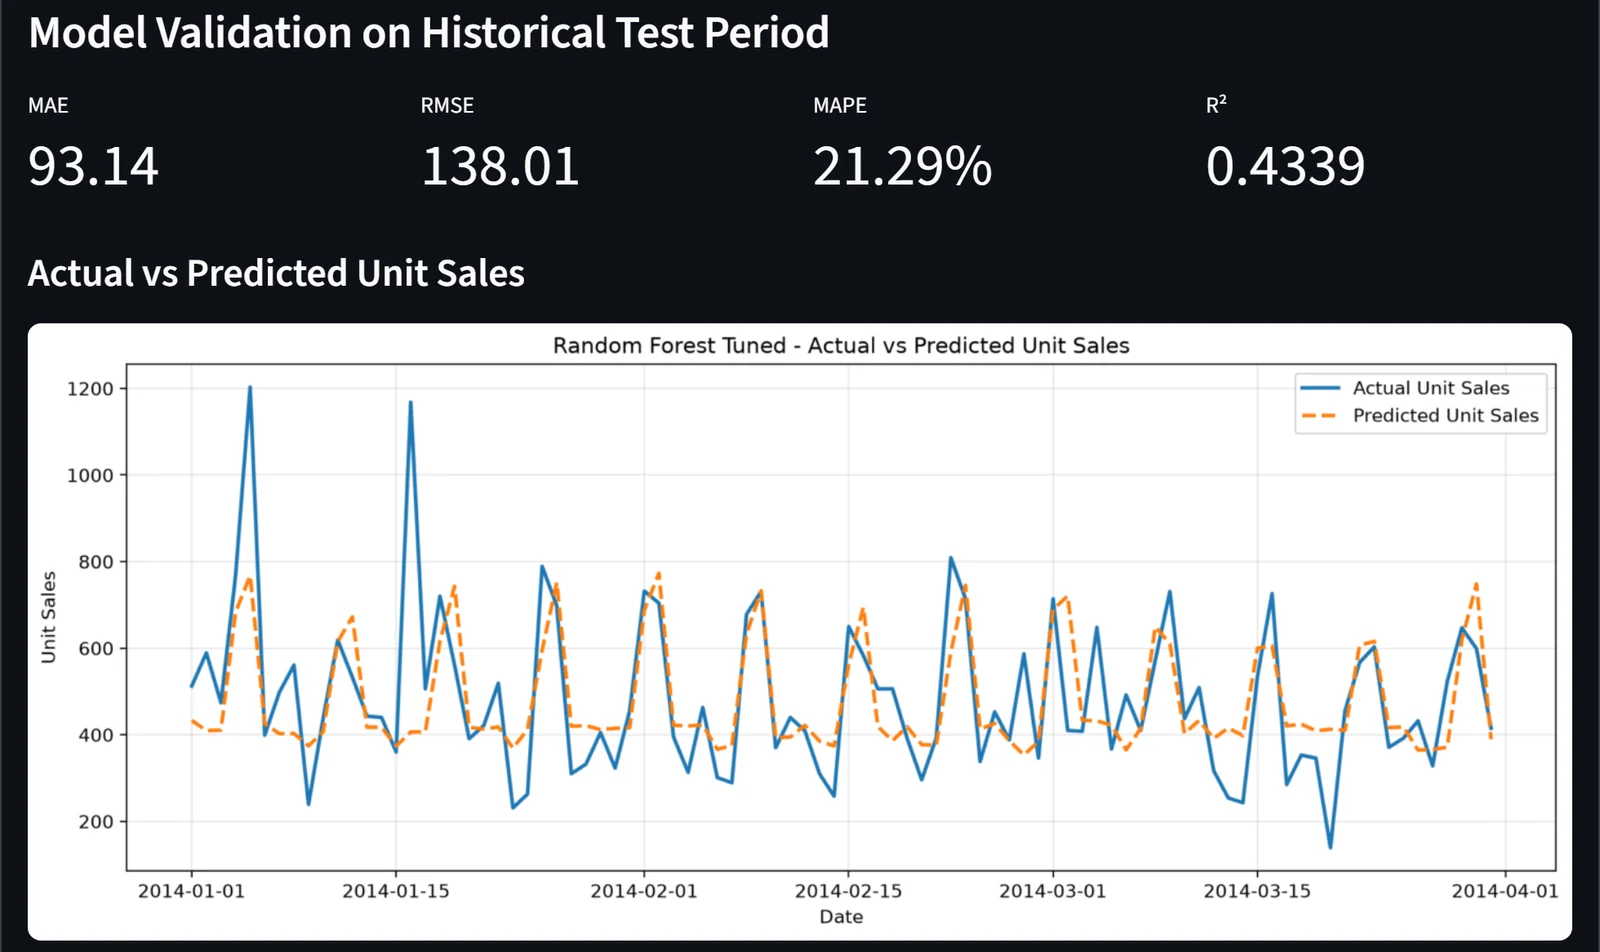
Champion: HyperOpt-tuned Random Forest
Why the forest beat the LSTM
On ~424 rows of daily data the deep model had too little to learn from. The HyperOpt-tuned Random Forest handled the engineered nonlinear features well, was simpler and more stable to deploy, and even chose a shallow max_depth of 3.
Why the comparison is fair
One chronological test window (Jan–Mar 2014) and the same metric set for every model. No shuffling; training always precedes the test. RMSE leads the scorecard because in retail a big miss on a high-demand day is what hurts inventory and staffing.
Deployment · Acceptance
A tool that speaks planning, not metrics
App features
- Cutoff date selector and forecast horizon
- KPI summary: total demand, average daily, peak day
- Historical comparison and CSV export
Documented limitation
The app forecasts inside the prepared test window only: it is a portfolio prototype running on pre-engineered rows. Real future dates would first need a pipeline that generates future calendar, holiday, oil, and recursive lag/rolling features. Knowing that difference is part of the craft.
See it run.
The app is deployed and public; every experiment behind the champion is tracked in MLflow and reproducible from the repository.