02 Projects / Process sheet PS-02
Predictive Maintenance
Three business questions answered on a 92,000-row logistics fleet dataset: which vehicles need maintenance, what it will cost, and how to segment the fleet by risk. Explained with SHAP.
Purpose & scope
Predict the failure before it stops the fleet
A logistics company needs to reduce unplanned breakdowns. The dataset: 92,000 vehicles, 27 features - usage hours, brake and tire condition, load, fuel efficiency, route, last maintenance date. Each business question maps to its own modeling task: classification, regression, clustering.
Operation sequence · Routing
Seven operations, one pipeline
One notebook per operation, plus five standalone SQL files that step from SELECT/WHERE to window functions.
| Op. | Operation | Scope |
|---|---|---|
| 10 | EDA | 27 features, class imbalance, correlation, outliers |
| 20 | Fleet SQL analysis | JOINs, CTEs, window functions on an 8-table star schema |
| 30 | Feature engineering | vehicle_age, overload_ratio, days_since_maintenance · leakage detection and removal |
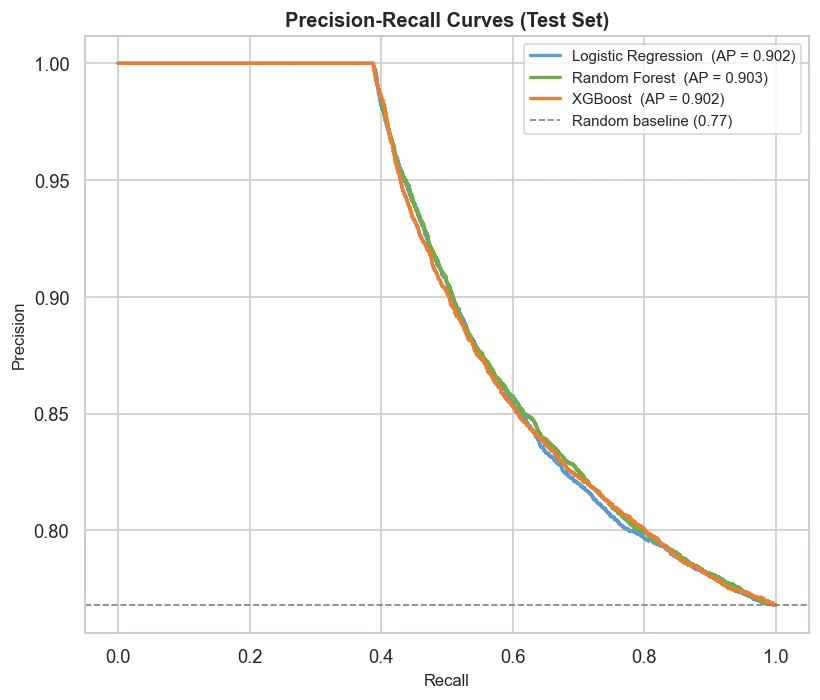
| 40 | Classification | Dummy → Logistic Regression → Random Forest → XGBoost · imbalance handled |
| 50 | Regression | Dummy → Linear → RF → XGBoost · log-transform for skewed targets |
| 60 | Clustering | KMeans (k=2) + DBSCAN · PCA visualization · post-hoc label validation |
| 70 | SHAP interpretation | global importance, beeswarm, dependence, waterfall for the highest-risk vehicle |
Measured values
Three tasks, three scorecards
Clustering, reported honestly
KMeans at k=2 scored a modest silhouette of 0.083, but the post-hoc validation gave the clusters an operational meaning: overloaded versus normally-loaded vehicles. A weak score with a real-world interpretation beats a pretty score without one.
Interpretation · SHAP
The model confirmed the domain knowledge
Key finding
Brake_Condition is the dominant risk predictor across the fleet. That is exactly what 17 years in vehicle development would suggest: the model did not replace the domain knowledge, it quantified and confirmed it. The SHAP waterfall for the single highest-risk vehicle turns that into a management-ready explanation.
Data discipline
Feature engineering included explicit leakage detection and removal, and the star schema (vehicle fact table plus brake, route, weather, model and other dimensions) kept the SQL analysis clean. Predictive quality is a data problem before it is a modeling problem.
Read the notebooks.
Seven notebooks and five SQL files, from raw fleet data to SHAP waterfalls: the full chain is public and reproducible.